Encl. (1) to COMDTINST 3500.2
Each screen identifies the risk factor being assessed and provides a brief description. For
additional information, the user can click on the More Information box located in the
upper right left hand corner of the screen. To rate your exposure to the risk factor, the
user can click once on the numeric value that best represents the user's exposure to the
risk factor, and then click the next button to advance to the next question, or the user can
double-click on the numeric value and be automatically advanced to the next question.
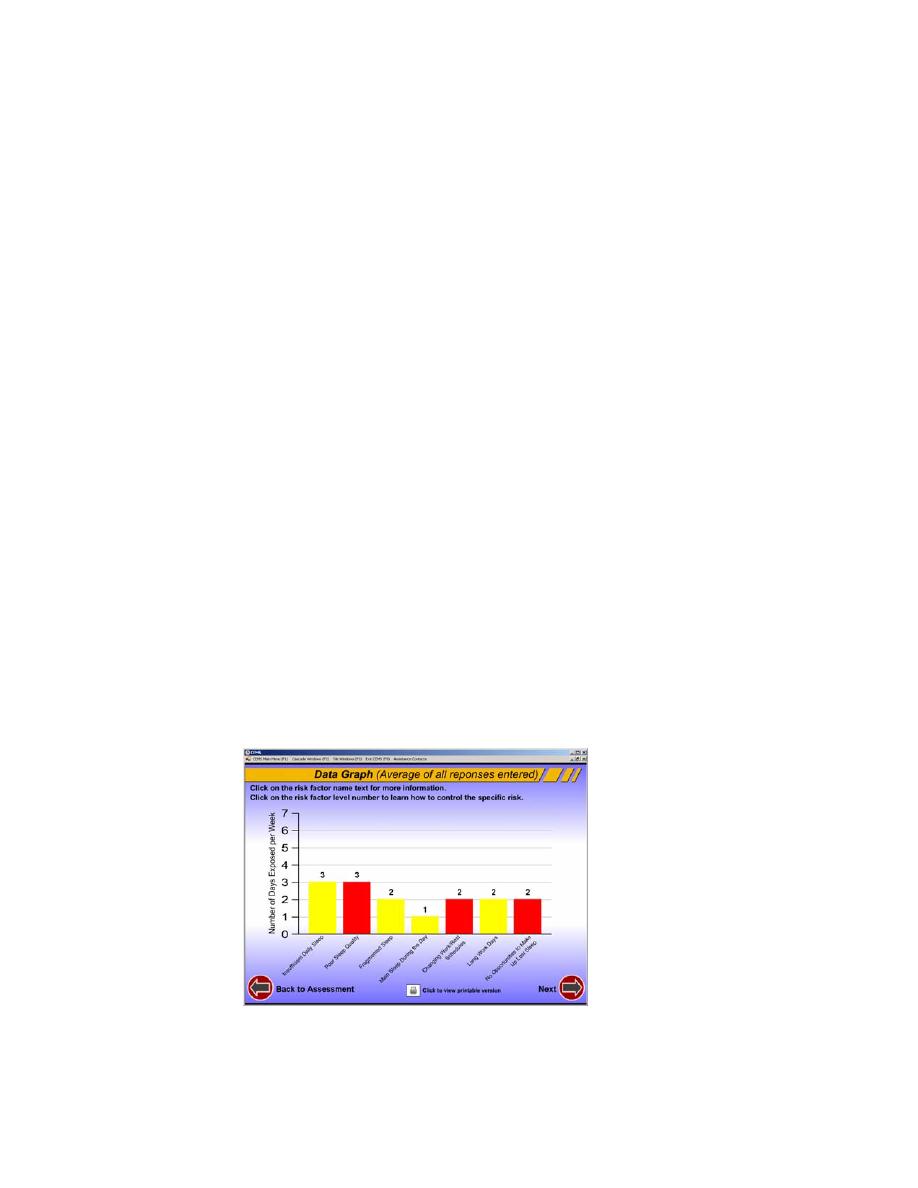
When all the questions have been answered, the results are represented in a bar-graph
format (Figure 2). These bar-graphs are referred to as `endurance risk profiles' and
represent the user's or unit's exposure to endurance risk. For the core risk factors
(described in the paragraph 4.b.(1) of this Instruction), the severity of the risk is
categorized by color: green indicates an acceptable level of risk exposure (no action is
required); yellow indicates a moderate level of risk exposure (control measures should be
considered); and red indicates a high level of risk exposure (control measures should be
implemented as soon as possible). While the core factors are physiologically based,
modulating factors have strong psychological and experiential influences that make
severity thresholds difficult to predict. For this reason, a color-coded severity threshold
is not used for the modulating risk factors. It is proposed that modulating risk factors
with exposure frequency values greater than 5 will compromise endurance and controls
should be considered. It is highly recommended that units look for opportunities to
reduce exposure to modulating factors, especially if exposure to core risk factors is high.
It is important to point out that any of the 15 endurance risk factors can degrade
performance and compromise operational safety and effectiveness. The simultaneous
presence of several risk factors is of great concern, because the negative influence of the
whole in such cases is often greater than the sum of the parts. To learn more about each
of the risk factors, the user can left-click on the risk factor name to access an online CEM
Guide that provides more detailed information on each endurance risk factor. To access
all the risk profile screens, the user continues to click the Next.
Figure 2. Screen shot showing an RFA endurance risk profile.
3


 Previous Page
