Encl. (5) COMDTINST 5224.9A
Presentation of Measures
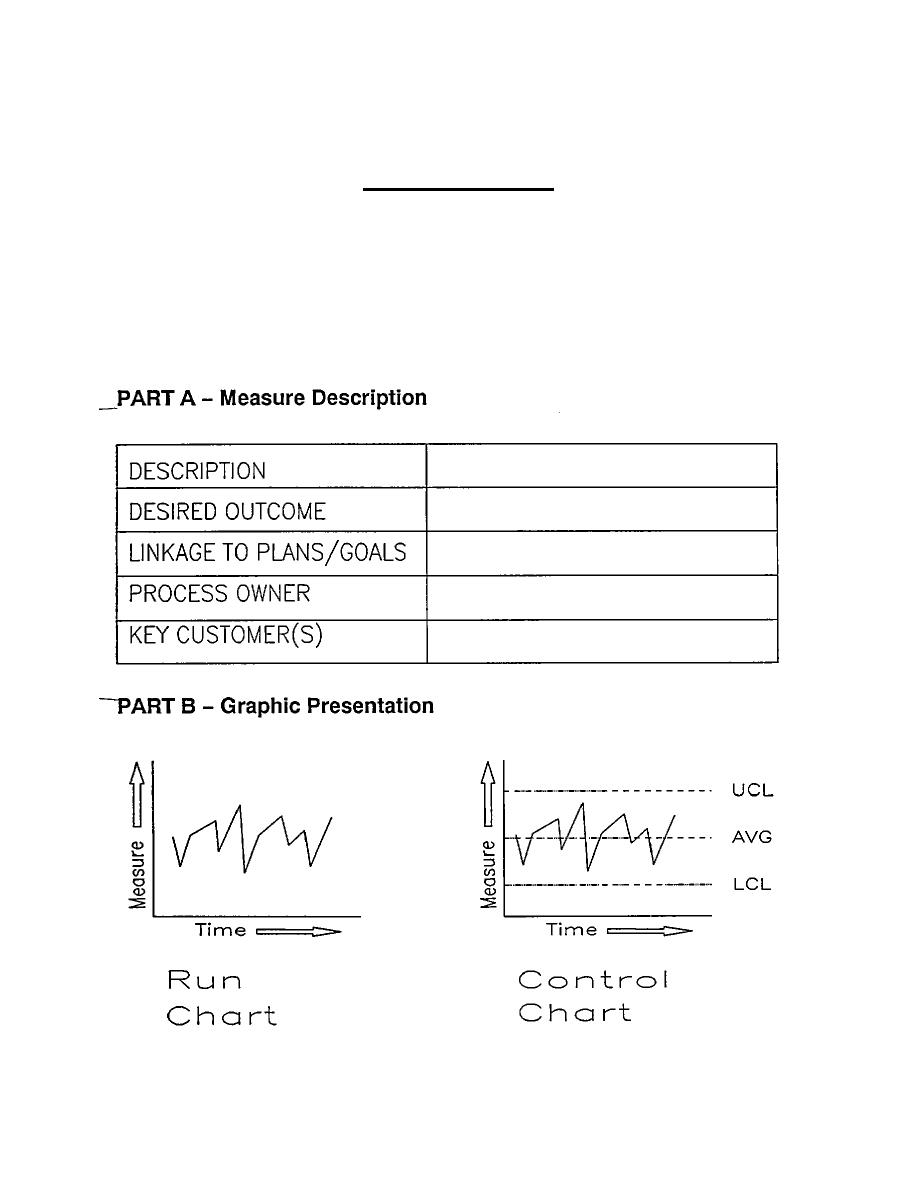
Information gathered from your measure must eventually be shared with stakeholders, decision-
makers and other individuals who affect your ability to meet customer needs. Use of graphics (i.e.
run charts, control charts, etc.) convert raw data into usable information. Graphics help
communicate the voice of the customer and the voice of the process. The standardized format
below presents your measure. This standard presentation will promote clearer thinking and easier
understanding of your measure. At a minimum, there are two parts required for the presentation of
a measure in the Coast Guard:


 Previous Page
