Tennessee River
Methyl mercury in the Tennesse River samples ranges from 0.04% (Sample SEL4)
to 0.23% (Sample PTU); concentrations range from 0.00009 mg/kg in samples ULU3
to 0.00045 mg/kg in sample SEL3. In Lake Chickamaugua, the data appear to
show a pattern with respect to location similar to that of total mercury,
increasing with distance downstream from Station MON to Station PTL and then
decreasing to Station ULU. This pattern corresponds to the increasing and
decreasing total organic carbon and clay, suggesting that the sediment
characteristics have the expected influence on methyl mercury concentrations
in sediments.
However, there does not appear to be any relationship between methyl mercury
concentration and batteries. This lack of relationship can be seen in Figure
3-7.
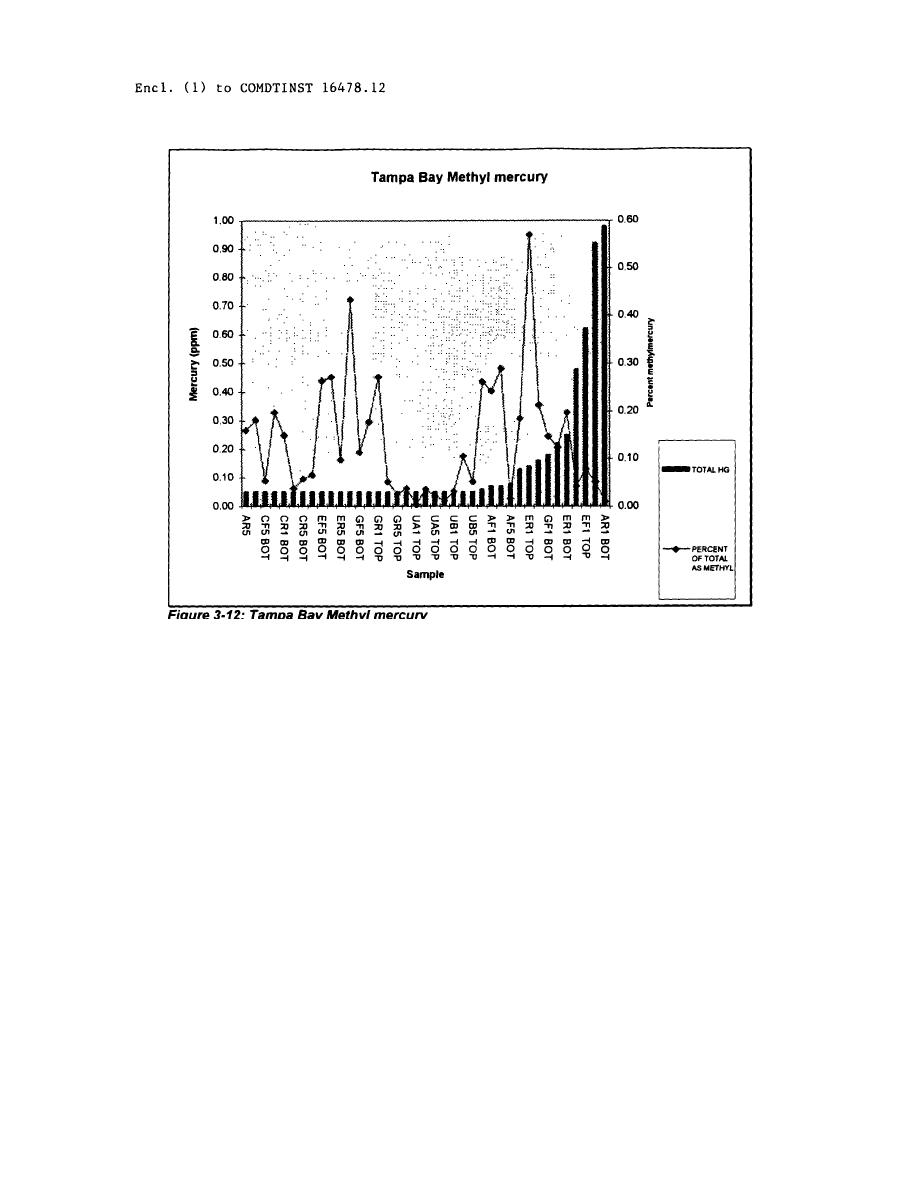
Methyl mercury generally represents 0.1 to 1.0 percent of the total mercury in
marine sediments. All samples had methyl mercury values below 0.23 percent,
which is at the low end of the range reported in the literature. Based on
this comparison, there does not appear to be a risk to benthos due to methyl
mercury.
3-13


 Previous Page
